WebRTC Statistics
[TODO full review]
Introduction
WebRTC streams (audio, video, or data) can be lost, and experience varying amounts of network delay. In order to assess the performance of WebRTC applications, it could be required to be able to monitor the WebRTC features of the underlying network and media pipeline.
To that aim, Kurento provides WebRTC statistics gathering for the server-side (Kurento Media Server, KMS). The implementation of this capability follows the guidelines provided in the W3C WebRTC’s Statistics API. Therefore, the statistics gathered in the KMS can be divided into two groups:
inboundrtp: statistics on the stream received in the KMS.
outboundrtp: statistics on the stream sent by KMS.
API description
As usual, WebRTC statistics gathering capability is provided by the KMS and is consumed by means of the different Kurento client implementations (Java, JavaScript clients are provided out of the box). To read these statistics, first it should be enabled using the method setLatencyStats of a Media Pipeline object. Using the Kurento Java client this is done as follows:
String kmsWsUri = "ws://localhost:8888/kurento";
KurentoClient kurentoClient = KurentoClient.create(kmsWsUri);
MediaPipeline mediaPipeline = kurentoClient.createMediaPipeline();
mediaPipeline.setLatencyStats(true);

// ...
… and using the JavaScript client:
var kmsWsUri = "ws://localhost:8888/kurento";
kurentoClient(kmsWsUri, function(error, kurentoClient) {
   kurentoClient.create("MediaPipeline", function(error, mediaPipeline) {
      mediaPipeline.setLatencyStats(true, function(error){

         // ...

      });
   });
});
Once WebRTC statistics are enabled, the second step is reading the statistics values using the method getStats of a Media Element, For example, to read the statistics of a WebRtcEndpoint object in Java:
WebRtcEndpoint webRtcEndpoint = new WebRtcEndpoint.Builder(mediaPipeline).build();
MediaType mediaType = ... // it can be MediaType.VIDEO, MediaType.AUDIO, or MediaType.DATA
Map<String, Stats> statsMap = webRtcEndpoint.getStats(mediaType);

// ...
… and in JavaScript:
mediaPipeline.create("WebRtcEndpoint", function(error, webRtcEndpoint) {
   var mediaType = ... // it can be 'VIDEO', 'AUDIO', or 'DATA'
   webRtcEndpoint.getStats(mediaType, function(error, statsMap) {

      // ...

   });
});
Notice that the WebRTC statistics are read as a map. Therefore, each entry of this collection has a key and a value, in which the key is the specific statistic, with a given value at the reading time. Take into account that these values make reference to real-time properties, and so these values vary in time depending on multiple factors (for instance network performance, KMS load, and so on). The complete description of the statistics are defined in the KMD interface description. The most relevant statistics are listed below:
ssrc: The synchronized source (SSRC).
firCount: Count the total number of Full Intra Request (FIR) packets received by the sender. This metric is only valid for video and is sent by receiver.
pliCount: Count the total number of Packet Loss Indication (PLI) packets received by the sender and is sent by receiver.
nackCount: Count the total number of Negative ACKnowledgement (NACK) packets received by the sender and is sent by receiver.
sliCount: Count the total number of Slice Loss Indication (SLI) packets received by the sender. This metric is only valid for video and is sent by receiver.
remb: The Receiver Estimated Maximum Bitrate (REMB). This metric is only valid for video.
packetsLost: Total number of RTP packets lost for this SSRC.
packetsReceived: Total number of RTP packets received for this SSRC.
bytesReceived: Total number of bytes received for this SSRC.
jitter: Packet Jitter measured in seconds for this SSRC.
packetsSent: Total number of RTP packets sent for this SSRC.
bytesSent: Total number of bytes sent for this SSRC.
targetBitrate: Presently configured bitrate target of this SSRC, in bits per second.
roundTripTime: Estimated round trip time (seconds) for this SSRC based on the RTCP timestamp.
E2ELatency: Array of average latencies (
MediaLatencyStat[]) for each media (audio, video), in nanoseconds.
All in all, the process for gathering WebRTC statistics in the KMS can be summarized in two steps: 1) Enable WebRTC statistics; 2) Read WebRTC. This process is illustrated in the following picture. This diagram also describes the JSON-RPC messages exchanged between Kurento client and KMS following the Kurento Protocol:
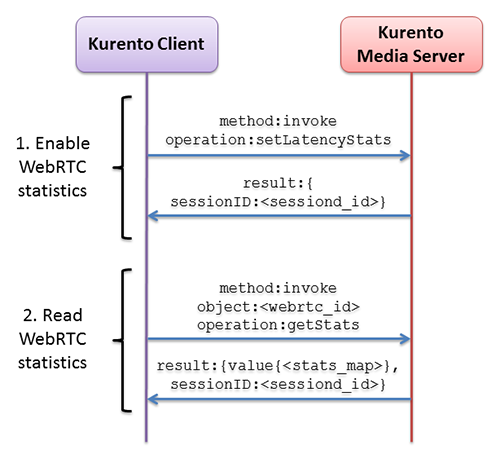
Sequence diagram for gathering WebRTC statistics in KMS
Example
There is a running tutorial which uses the WebRTC gathering as described before. This demo has been implemented using the JavaScript client and it is available on GitHub: kurento-loopback-stats.
From a the Media Pipeline point of view, this demo application consists in a WebRtcEndpoint in loopback. Once the demo is up and running, WebRTC are enabled and gathered with a rate of 1 second.
In addition to the KMS WebRTC statistics, client-side (i.e. browser WebRTC peer) stats are also gathered by the application. This is done using the standard method provided by the RTCPeerConnection object, i.e using its method getStats. Please check out the JavaScript logic located in the index.js file for implementation details.
Both kinds of WebRTC statistics values (i.e. browser and KMS side) are updated and shown each second in the application GUI, as follows:
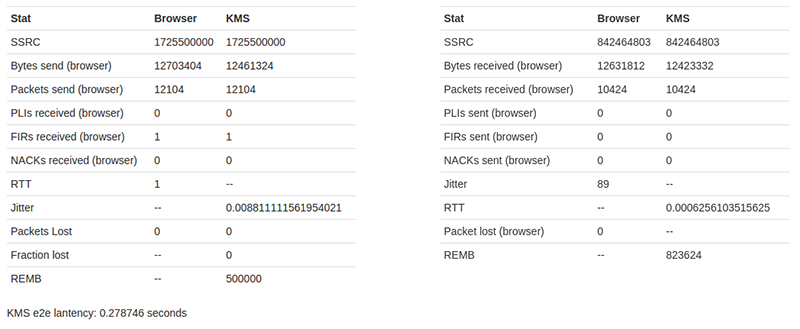
Statistics results in the kurento-loopback-stats demo GUI